Exploring the NHC Advisories and Sea Surface Height during Hurricane Irma
This notebook aims to demonstrate how to create a simple interactive GIS map with the National Hurricane Center predictions [1] and the observed sea surface height from CO-OPS [2].
See https://tidesandcurrents.noaa.gov/quicklook/view.html?name=IRMA for the latest information on Irma.
First we have to download the National Hurricane Center (NHC) GIS 5 day predictions data for Irma.
NHC codes storms are coded with 8 letter names:
2 char for region
al→ Atlantic2 char for number
11is Irmaand 4 char for year,
2017
Browse http://www.nhc.noaa.gov/gis/archive_wsurge.php?year=2017 to find other hurricanes code.
code = "al112017"
hurricane = "{}_5day".format(code)
import os
import sys
import lxml.html
try:
from urllib.request import urlopen, urlretrieve
except Exception:
from urllib import urlopen, urlretrieve
def url_lister(url):
urls = []
connection = urlopen(url)
dom = lxml.html.fromstring(connection.read())
for link in dom.xpath("//a/@href"):
urls.append(link)
return urls
def download(url, path):
sys.stdout.write(fname + "\n")
if not os.path.isfile(path):
urlretrieve(url, filename=path, reporthook=progress_hook(sys.stdout))
sys.stdout.write("\n")
sys.stdout.flush()
def progress_hook(out):
"""
Return a progress hook function, suitable for passing to
urllib.retrieve, that writes to the file object *out*.
"""
def it(n, bs, ts):
got = n * bs
if ts < 0:
outof = ""
else:
# On the last block n*bs can exceed ts, so we clamp it
# to avoid awkward questions.
got = min(got, ts)
outof = "/%d [%d%%]" % (ts, 100 * got // ts)
out.write("\r %d%s" % (got, outof))
out.flush()
return it
nhc = "http://www.nhc.noaa.gov/gis/forecast/archive/"
# We don't need the latest file b/c that is redundant to the latest number.
fnames = [
fname
for fname in url_lister(nhc)
if fname.startswith(hurricane) and "latest" not in fname
]
base = os.path.abspath(os.path.join(os.path.curdir, "data", hurricane))
if not os.path.exists(base):
os.makedirs(base)
for fname in fnames:
url = "{}/{}".format(nhc, fname)
path = os.path.join(base, fname)
download(url, path)
al112017_5day_001.zip
al112017_5day_002.zip
al112017_5day_003.zip
al112017_5day_004.zip
al112017_5day_005.zip
al112017_5day_006.zip
al112017_5day_007.zip
al112017_5day_008.zip
al112017_5day_009.zip
al112017_5day_010.zip
al112017_5day_011.zip
al112017_5day_012.zip
al112017_5day_013.zip
al112017_5day_014.zip
al112017_5day_015.zip
al112017_5day_016.zip
al112017_5day_017.zip
al112017_5day_018.zip
al112017_5day_018A.zip
al112017_5day_019.zip
al112017_5day_019A.zip
al112017_5day_020.zip
al112017_5day_020A.zip
al112017_5day_021.zip
al112017_5day_021A.zip
al112017_5day_022.zip
al112017_5day_022A.zip
al112017_5day_023.zip
al112017_5day_023A.zip
al112017_5day_024.zip
al112017_5day_025.zip
al112017_5day_026.zip
al112017_5day_026A.zip
al112017_5day_027.zip
al112017_5day_027A.zip
al112017_5day_028.zip
al112017_5day_028A.zip
al112017_5day_029.zip
al112017_5day_029A.zip
al112017_5day_030.zip
al112017_5day_030A.zip
al112017_5day_031.zip
al112017_5day_031A.zip
al112017_5day_032.zip
al112017_5day_032A.zip
al112017_5day_033.zip
al112017_5day_033A.zip
al112017_5day_034.zip
al112017_5day_034A.zip
al112017_5day_035.zip
al112017_5day_035A.zip
al112017_5day_036.zip
al112017_5day_036A.zip
al112017_5day_037.zip
al112017_5day_037A.zip
al112017_5day_038.zip
al112017_5day_038A.zip
al112017_5day_039.zip
al112017_5day_039A.zip
al112017_5day_040.zip
al112017_5day_040A.zip
al112017_5day_041.zip
al112017_5day_041A.zip
al112017_5day_042.zip
al112017_5day_042A.zip
al112017_5day_043.zip
al112017_5day_043A.zip
al112017_5day_044.zip
al112017_5day_044A.zip
al112017_5day_045.zip
al112017_5day_045A.zip
al112017_5day_046.zip
al112017_5day_046A.zip
al112017_5day_047.zip
al112017_5day_047A.zip
al112017_5day_048.zip
al112017_5day_048A.zip
al112017_5day_049.zip
al112017_5day_049A.zip
al112017_5day_050.zip
al112017_5day_050A.zip
al112017_5day_051.zip
al112017_5day_051A.zip
al112017_5day_052.zip
In the cells below we use geopandas to load the data we just downloaded. We will use only the prediction cone (png) and the track points (pts), but feel free to explore this data further, there is plenty more there.
import os
os.environ["CPL_ZIP_ENCODING"] = "UTF-8"
os.environ["TZ"] = "GMT0"
from glob import glob
import geopandas
cones, points = [], []
for fname in sorted(glob(os.path.join(base, "{}_*.zip".format(hurricane)))):
number = os.path.splitext(os.path.split(fname)[-1])[0].split("_")[-1]
pgn = geopandas.read_file(
"/{}-{}_5day_pgn.shp".format(code, number), vfs="zip://{}".format(fname)
)
cones.append(pgn)
pts = geopandas.read_file(
"/{}-{}_5day_pts.shp".format(code, number), vfs="zip://{}".format(fname)
)
# Only the first "obsevartion."
points.append(pts.iloc[0])
Let’s create a color code for the point track.
colors = {
"Subtropical Depression": "yellow",
"Tropical Depression": "yellow",
"Tropical Storm": "orange",
"Subtropical Storm": "orange",
"Hurricane": "red",
"Major Hurricane": "crimson",
}
Now we can get all the information we need from those GIS files. Let’s start with the event dates.
import dateutil
start = points[0]["FLDATELBL"].strip(" AST")
end = points[-1]["FLDATELBL"].strip(" EDT")
start = dateutil.parser.parse(start)
end = dateutil.parser.parse(end)
And the bounding box to search the data.
from shapely.geometry import LineString
from shapely.ops import cascaded_union
last_cone = cones[-1]["geometry"].iloc[0]
track = LineString([point["geometry"] for point in points])
polygon = cascaded_union([last_cone, track])
# Add a buffer to find the stations along the track.
bbox = polygon.buffer(2).bounds
Note that the bounding box is derived from the track and the latest prediction cone.
strbbox = ", ".join(format(v, ".2f") for v in bbox)
print("bbox: {}\nstart: {}\n end: {}".format(strbbox, start, end))
bbox: -91.91, 14.40, -28.30, 39.45
start: 2017-08-30 08:00:00
end: 2017-09-11 20:00:00
Now we need to build a filter with those parameters to find the observations along the Hurricane path. We still need to specify:
the units for the observations;
and the SOS name for the variables of interest.
Next, we can use pyoos to assemble a collector to download the data into a pandas DataFrame.
import cf_units
import pandas as pd
from ioos_tools.ioos import collector2table
from pyoos.collectors.coops.coops_sos import CoopsSos
from retrying import retry
# We need to retry in case of failure b/c the server cannot handle
# the high traffic during events like Irma.
@retry(stop_max_attempt_number=5, wait_fixed=3000)
def get_coops(start, end, sos_name, units, bbox, verbose=False):
collector = CoopsSos()
collector.set_bbox(bbox)
collector.end_time = end
collector.start_time = start
collector.variables = [sos_name]
ofrs = collector.server.offerings
title = collector.server.identification.title
config = dict(units=units, sos_name=sos_name,)
data = collector2table(
collector=collector,
config=config,
col="{} ({})".format(sos_name, units.format(cf_units.UT_ISO_8859_1)),
)
# Clean the table.
table = dict(
station_name=[s._metadata.get("station_name") for s in data],
station_code=[s._metadata.get("station_code") for s in data],
sensor=[s._metadata.get("sensor") for s in data],
lon=[s._metadata.get("lon") for s in data],
lat=[s._metadata.get("lat") for s in data],
depth=[s._metadata.get("depth", "NA") for s in data],
)
table = pd.DataFrame(table).set_index("station_name")
if verbose:
print("Collector offerings")
print("{}: {} offerings".format(title, len(ofrs)))
return data, table
ssh, ssh_table = get_coops(
start=start,
end=end,
sos_name="water_surface_height_above_reference_datum",
units=cf_units.Unit("meters"),
bbox=bbox,
)
ssh_table
| station_code | sensor | lon | lat | depth | |
|---|---|---|---|---|---|
| station_name | |||||
| Bermuda Biological Station | 2695535 | urn:ioos:sensor:NOAA.NOS.CO-OPS:2695535:N1 | -64.6950 | 32.3700 | None |
| Bermuda, St. Georges Island, Bermuda | 2695540 | urn:ioos:sensor:NOAA.NOS.CO-OPS:2695540:Y1 | -64.7033 | 32.3733 | None |
| Atlantic City, NJ | 8534720 | urn:ioos:sensor:NOAA.NOS.CO-OPS:8534720:A1 | -74.4181 | 39.3567 | None |
| Cape May, NJ | 8536110 | urn:ioos:sensor:NOAA.NOS.CO-OPS:8536110:A1 | -74.9597 | 38.9678 | None |
| Ship John Shoal, NJ | 8537121 | urn:ioos:sensor:NOAA.NOS.CO-OPS:8537121:A1 | -75.3750 | 39.3050 | None |
| Brandywine Shoal Light, DE | 8555889 | urn:ioos:sensor:NOAA.NOS.CO-OPS:8555889:Y1 | -75.1130 | 38.9870 | None |
| Lewes, DE | 8557380 | urn:ioos:sensor:NOAA.NOS.CO-OPS:8557380:A1 | -75.1192 | 38.7828 | None |
| Ocean City Inlet, MD | 8570283 | urn:ioos:sensor:NOAA.NOS.CO-OPS:8570283:A1 | -75.0911 | 38.3283 | None |
| Bishops Head, MD | 8571421 | urn:ioos:sensor:NOAA.NOS.CO-OPS:8571421:A1 | -76.0387 | 38.2204 | None |
| Cambridge, MD | 8571892 | urn:ioos:sensor:NOAA.NOS.CO-OPS:8571892:Y1 | -76.0617 | 38.5725 | None |
| Tolchester Beach, MD | 8573364 | urn:ioos:sensor:NOAA.NOS.CO-OPS:8573364:A1 | -76.2450 | 39.2133 | None |
| Baltimore, Fort McHenry, Patapsco River, MD | 8574680 | urn:ioos:sensor:NOAA.NOS.CO-OPS:8574680:A1 | -76.5794 | 39.2669 | None |
| Annapolis, MD | 8575512 | urn:ioos:sensor:NOAA.NOS.CO-OPS:8575512:A1 | -76.4816 | 38.9833 | None |
| Solomons Island, MD | 8577330 | urn:ioos:sensor:NOAA.NOS.CO-OPS:8577330:Y1 | -76.4508 | 38.3172 | None |
| Washington, DC | 8594900 | urn:ioos:sensor:NOAA.NOS.CO-OPS:8594900:A1 | -77.0217 | 38.8730 | None |
| Wachapreague, VA | 8631044 | urn:ioos:sensor:NOAA.NOS.CO-OPS:8631044:Y1 | -75.6858 | 37.6078 | None |
| Kiptopeke, VA | 8632200 | urn:ioos:sensor:NOAA.NOS.CO-OPS:8632200:A1 | -75.9884 | 37.1652 | None |
| Dahlgren, VA | 8635027 | urn:ioos:sensor:NOAA.NOS.CO-OPS:8635027:Y1 | -77.0366 | 38.3197 | None |
| Lewisetta, VA | 8635750 | urn:ioos:sensor:NOAA.NOS.CO-OPS:8635750:A1 | -76.4647 | 37.9953 | None |
| Windmill Point, VA | 8636580 | urn:ioos:sensor:NOAA.NOS.CO-OPS:8636580:Y1 | -76.2900 | 37.6161 | None |
| Yorktown USCG Training Center, VA | 8637689 | urn:ioos:sensor:NOAA.NOS.CO-OPS:8637689:A1 | -76.4788 | 37.2265 | None |
| Sewells Point, VA | 8638610 | urn:ioos:sensor:NOAA.NOS.CO-OPS:8638610:A1 | -76.3300 | 36.9467 | None |
| CBBT, Chesapeake Channel, VA | 8638901 | urn:ioos:sensor:NOAA.NOS.CO-OPS:8638901:Y1 | -76.0833 | 37.0329 | None |
| Money Point, VA | 8639348 | urn:ioos:sensor:NOAA.NOS.CO-OPS:8639348:Y1 | -76.3017 | 36.7783 | None |
| Duck, NC | 8651370 | urn:ioos:sensor:NOAA.NOS.CO-OPS:8651370:A1 | -75.7467 | 36.1833 | None |
| Oregon Inlet Marina, NC | 8652587 | urn:ioos:sensor:NOAA.NOS.CO-OPS:8652587:A1 | -75.5481 | 35.7950 | None |
| USCG Station Hatteras, NC | 8654467 | urn:ioos:sensor:NOAA.NOS.CO-OPS:8654467:A1 | -75.7042 | 35.2086 | None |
| Beaufort, Duke Marine Lab, NC | 8656483 | urn:ioos:sensor:NOAA.NOS.CO-OPS:8656483:Y1 | -76.6700 | 34.7200 | None |
| Wilmington, NC | 8658120 | urn:ioos:sensor:NOAA.NOS.CO-OPS:8658120:A1 | -77.9536 | 34.2275 | None |
| Wrightsville Beach, NC | 8658163 | urn:ioos:sensor:NOAA.NOS.CO-OPS:8658163:A1 | -77.7867 | 34.2133 | None |
| ... | ... | ... | ... | ... | ... |
| West Fowl River Bridge, AL | 8738043 | urn:ioos:sensor:NOAA.NOS.CO-OPS:8738043:Y1 | -88.1586 | 30.3766 | None |
| Bayou La Batre Bridge, AL | 8739803 | urn:ioos:sensor:NOAA.NOS.CO-OPS:8739803:Y1 | -88.2478 | 30.4062 | None |
| Pascagoula NOAA Lab, MS | 8741533 | urn:ioos:sensor:NOAA.NOS.CO-OPS:8741533:A1 | -88.5631 | 30.3678 | None |
| Bay Waveland Yacht Club, MS | 8747437 | urn:ioos:sensor:NOAA.NOS.CO-OPS:8747437:A1 | -89.3250 | 30.3250 | None |
| Pilottown, LA | 8760721 | urn:ioos:sensor:NOAA.NOS.CO-OPS:8760721:A1 | -89.2583 | 29.1783 | None |
| Pilots Station East, S.W. Pass, LA | 8760922 | urn:ioos:sensor:NOAA.NOS.CO-OPS:8760922:Y1 | -89.4075 | 28.9322 | None |
| Shell Beach, LA | 8761305 | urn:ioos:sensor:NOAA.NOS.CO-OPS:8761305:A1 | -89.6730 | 29.8683 | None |
| Grand Isle, LA | 8761724 | urn:ioos:sensor:NOAA.NOS.CO-OPS:8761724:A1 | -89.9567 | 29.2633 | None |
| New Canal Station, LA | 8761927 | urn:ioos:sensor:NOAA.NOS.CO-OPS:8761927:A1 | -90.1133 | 30.0272 | None |
| Carrollton, LA | 8761955 | urn:ioos:sensor:NOAA.NOS.CO-OPS:8761955:A1 | -90.1355 | 29.9329 | None |
| Port Fourchon, Belle Pass, LA | 8762075 | urn:ioos:sensor:NOAA.NOS.CO-OPS:8762075:A1 | -90.1993 | 29.1142 | None |
| West Bank 1, Bayou Gauche, LA | 8762482 | urn:ioos:sensor:NOAA.NOS.CO-OPS:8762482:Y1 | -90.4203 | 29.7886 | None |
| I-10 Bonnet Carre Floodway, LA | 8762483 | urn:ioos:sensor:NOAA.NOS.CO-OPS:8762483:Y1 | -90.3900 | 30.0679 | None |
| Berwick, Atchafalaya River, LA | 8764044 | urn:ioos:sensor:NOAA.NOS.CO-OPS:8764044:A1 | -91.2376 | 29.6675 | None |
| LAWMA, Amerada Pass, LA | 8764227 | urn:ioos:sensor:NOAA.NOS.CO-OPS:8764227:Y1 | -91.3381 | 29.4496 | None |
| Eugene Island, North of , Gulf of Mexico, LA | 8764314 | urn:ioos:sensor:NOAA.NOS.CO-OPS:8764314:Y1 | -91.3839 | 29.3675 | None |
| Christiansted Harbor, St Croix, VI | 9751364 | urn:ioos:sensor:NOAA.NOS.CO-OPS:9751364:A1 | -64.6984 | 17.7477 | None |
| Lameshur Bay, St John, VI | 9751381 | urn:ioos:sensor:NOAA.NOS.CO-OPS:9751381:A1 | -64.7242 | 18.3182 | None |
| Lime Tree Bay, VI | 9751401 | urn:ioos:sensor:NOAA.NOS.CO-OPS:9751401:Y1 | -64.7538 | 17.6947 | None |
| Charlotte Amalie, VI | 9751639 | urn:ioos:sensor:NOAA.NOS.CO-OPS:9751639:Y1 | -64.9258 | 18.3472 | None |
| Culebra, PR | 9752235 | urn:ioos:sensor:NOAA.NOS.CO-OPS:9752235:NT | -65.3025 | 18.3009 | None |
| Isabel Segunda, Vieques Island, PR | 9752619 | urn:ioos:sensor:NOAA.NOS.CO-OPS:9752619:A1 | -65.4439 | 18.1525 | None |
| Esperanza, Vieques Island, PR | 9752695 | urn:ioos:sensor:NOAA.NOS.CO-OPS:9752695:A1 | -65.4714 | 18.0939 | None |
| Yabucoa Harbor, PR | 9754228 | urn:ioos:sensor:NOAA.NOS.CO-OPS:9754228:A1 | -65.8330 | 18.0551 | None |
| San Juan, La Puntilla, San Juan Bay, PR | 9755371 | urn:ioos:sensor:NOAA.NOS.CO-OPS:9755371:Y1 | -66.1164 | 18.4592 | None |
| Arecibo, PR | 9757809 | urn:ioos:sensor:NOAA.NOS.CO-OPS:9757809:A1 | -66.7024 | 18.4805 | None |
| Magueyes Island, PR | 9759110 | urn:ioos:sensor:NOAA.NOS.CO-OPS:9759110:A1 | -67.0464 | 17.9701 | None |
| Mayaguez, PR | 9759394 | urn:ioos:sensor:NOAA.NOS.CO-OPS:9759394:Y1 | -67.1625 | 18.2190 | None |
| Mona Island, PR | 9759938 | urn:ioos:sensor:NOAA.NOS.CO-OPS:9759938:N1 | -67.9385 | 18.0899 | None |
| Barbuda, Antigua and Barbuda | 9761115 | urn:ioos:sensor:NOAA.NOS.CO-OPS:9761115:N1 | -61.8206 | 17.5908 | None |
93 rows × 5 columns
wind_speed, wind_speed_table = get_coops(
start=start, end=end, sos_name="wind_speed", units=cf_units.Unit("m/s"), bbox=bbox,
)
wind_speed_table
| station_code | sensor | lon | lat | depth | |
|---|---|---|---|---|---|
| station_name | |||||
| Bermuda, St. Georges Island, Bermuda | 2695540 | urn:ioos:sensor:NOAA.NOS.CO-OPS:2695540:C1 | -64.7033 | 32.3734 | None |
| Cape May, NJ | 8536110 | urn:ioos:sensor:NOAA.NOS.CO-OPS:8536110:C1 | -74.9597 | 38.9678 | None |
| Ship John Shoal, NJ | 8537121 | urn:ioos:sensor:NOAA.NOS.CO-OPS:8537121:C1 | -75.3750 | 39.3050 | None |
| Brandywine Shoal Light, DE | 8555889 | urn:ioos:sensor:NOAA.NOS.CO-OPS:8555889:C1 | -75.1133 | 38.9867 | None |
| Lewes, DE | 8557380 | urn:ioos:sensor:NOAA.NOS.CO-OPS:8557380:C1 | -75.1192 | 38.7828 | None |
| Ocean City Inlet, MD | 8570283 | urn:ioos:sensor:NOAA.NOS.CO-OPS:8570283:C1 | -75.0917 | 38.3283 | None |
| Bishops Head, MD | 8571421 | urn:ioos:sensor:NOAA.NOS.CO-OPS:8571421:C1 | -76.0387 | 38.2204 | None |
| Tolchester Beach, MD | 8573364 | urn:ioos:sensor:NOAA.NOS.CO-OPS:8573364:C1 | -76.2450 | 39.2133 | None |
| Baltimore, Fort McHenry, Patapsco River, MD | 8574680 | urn:ioos:sensor:NOAA.NOS.CO-OPS:8574680:C1 | -76.5783 | 39.2667 | None |
| Francis Scott Key Bridge, MD | 8574728 | urn:ioos:sensor:NOAA.NOS.CO-OPS:8574728:C1 | -76.5283 | 39.2200 | None |
| Cove Point LNG Pier, MD | 8577018 | urn:ioos:sensor:NOAA.NOS.CO-OPS:8577018:C1 | -76.3855 | 38.4044 | None |
| Solomons Island, MD | 8577330 | urn:ioos:sensor:NOAA.NOS.CO-OPS:8577330:C1 | -76.4508 | 38.3172 | None |
| Piney Point, MD | 8578240 | urn:ioos:sensor:NOAA.NOS.CO-OPS:8578240:C1 | -76.5333 | 38.1333 | None |
| Washington, DC | 8594900 | urn:ioos:sensor:NOAA.NOS.CO-OPS:8594900:C1 | -77.0217 | 38.8733 | None |
| Wachapreague, VA | 8631044 | urn:ioos:sensor:NOAA.NOS.CO-OPS:8631044:C1 | -75.6858 | 37.6078 | None |
| Kiptopeke, VA | 8632200 | urn:ioos:sensor:NOAA.NOS.CO-OPS:8632200:C1 | -75.9884 | 37.1652 | None |
| Rappahannock Light, VA | 8632837 | urn:ioos:sensor:NOAA.NOS.CO-OPS:8632837:C1 | -76.0150 | 37.5383 | None |
| Dahlgren, VA | 8635027 | urn:ioos:sensor:NOAA.NOS.CO-OPS:8635027:C1 | -77.0366 | 38.3197 | None |
| Lewisetta, VA | 8635750 | urn:ioos:sensor:NOAA.NOS.CO-OPS:8635750:C1 | -76.4646 | 37.9954 | None |
| York River East Rear Range Light, VA | 8637611 | urn:ioos:sensor:NOAA.NOS.CO-OPS:8637611:C1 | -76.3333 | 37.2500 | None |
| Yorktown USCG Training Center, VA | 8637689 | urn:ioos:sensor:NOAA.NOS.CO-OPS:8637689:C1 | -76.4788 | 37.2265 | None |
| Dominion Terminal Associates, VA | 8638511 | urn:ioos:sensor:NOAA.NOS.CO-OPS:8638511:C1 | -76.4242 | 36.9623 | None |
| South Craney Island, VA | 8638595 | urn:ioos:sensor:NOAA.NOS.CO-OPS:8638595:C1 | -76.3383 | 36.8883 | None |
| Willoughby Degaussing Station, VA | 8638614 | urn:ioos:sensor:NOAA.NOS.CO-OPS:8638614:C1 | -76.3217 | 36.9817 | None |
| urn:ioos:station:NOAA.NOS.CO-OPS:8638863 | 8638863 | urn:ioos:sensor:NOAA.NOS.CO-OPS:8638863:C1 | -76.1133 | 36.9667 | None |
| CBBT, Chesapeake Channel, VA | 8638901 | urn:ioos:sensor:NOAA.NOS.CO-OPS:8638901:C1 | -76.0833 | 37.0329 | None |
| Cape Henry, VA | 8638999 | urn:ioos:sensor:NOAA.NOS.CO-OPS:8638999:C1 | -76.0067 | 36.9300 | None |
| Money Point, VA | 8639348 | urn:ioos:sensor:NOAA.NOS.CO-OPS:8639348:C1 | -76.3017 | 36.7783 | None |
| Duck, NC | 8651370 | urn:ioos:sensor:NOAA.NOS.CO-OPS:8651370:C1 | -75.7467 | 36.1833 | None |
| Oregon Inlet Marina, NC | 8652587 | urn:ioos:sensor:NOAA.NOS.CO-OPS:8652587:C1 | -75.5481 | 35.7950 | None |
| ... | ... | ... | ... | ... | ... |
| Panama City, FL | 8729108 | urn:ioos:sensor:NOAA.NOS.CO-OPS:8729108:C1 | -85.6669 | 30.1523 | None |
| Panama City Beach, FL | 8729210 | urn:ioos:sensor:NOAA.NOS.CO-OPS:8729210:C1 | -85.8783 | 30.2133 | None |
| Fort Morgan, AL | 8734673 | urn:ioos:sensor:NOAA.NOS.CO-OPS:8734673:C1 | -88.0250 | 30.2283 | None |
| Dauphin Island, AL | 8735180 | urn:ioos:sensor:NOAA.NOS.CO-OPS:8735180:C1 | -88.0750 | 30.2500 | None |
| Coast Guard Sector Mobile, AL | 8736897 | urn:ioos:sensor:NOAA.NOS.CO-OPS:8736897:C1 | -88.0583 | 30.6483 | None |
| Petit Bois Island, Port of Pascagoula, MS | 8741003 | urn:ioos:sensor:NOAA.NOS.CO-OPS:8741003:C1 | -88.5000 | 30.2133 | None |
| urn:ioos:station:NOAA.NOS.CO-OPS:8741094 | 8741094 | urn:ioos:sensor:NOAA.NOS.CO-OPS:8741094:C1 | -88.5117 | 30.3433 | None |
| urn:ioos:station:NOAA.NOS.CO-OPS:8741501 | 8741501 | urn:ioos:sensor:NOAA.NOS.CO-OPS:8741501:C1 | -88.5667 | 30.3550 | None |
| Bay Waveland Yacht Club, MS | 8747437 | urn:ioos:sensor:NOAA.NOS.CO-OPS:8747437:C1 | -89.3250 | 30.3250 | None |
| Pilottown, LA | 8760721 | urn:ioos:sensor:NOAA.NOS.CO-OPS:8760721:C1 | -89.2583 | 29.1783 | None |
| Pilots Station East, S.W. Pass, LA | 8760922 | urn:ioos:sensor:NOAA.NOS.CO-OPS:8760922:C1 | -89.4075 | 28.9322 | None |
| Shell Beach, LA | 8761305 | urn:ioos:sensor:NOAA.NOS.CO-OPS:8761305:C1 | -89.6732 | 29.8681 | None |
| Grand Isle, LA | 8761724 | urn:ioos:sensor:NOAA.NOS.CO-OPS:8761724:C1 | -89.9567 | 29.2633 | None |
| New Canal Station, LA | 8761927 | urn:ioos:sensor:NOAA.NOS.CO-OPS:8761927:C1 | -90.1133 | 30.0272 | None |
| West Bank 1, Bayou Gauche, LA | 8762482 | urn:ioos:sensor:NOAA.NOS.CO-OPS:8762482:C1 | -90.4203 | 29.7886 | None |
| Berwick, Atchafalaya River, LA | 8764044 | urn:ioos:sensor:NOAA.NOS.CO-OPS:8764044:C1 | -91.2376 | 29.6675 | None |
| LAWMA, Amerada Pass, LA | 8764227 | urn:ioos:sensor:NOAA.NOS.CO-OPS:8764227:C1 | -91.3381 | 29.4496 | None |
| Eugene Island, North of , Gulf of Mexico, LA | 8764314 | urn:ioos:sensor:NOAA.NOS.CO-OPS:8764314:C1 | -91.3839 | 29.3675 | None |
| Christiansted Harbor, St Croix, VI | 9751364 | urn:ioos:sensor:NOAA.NOS.CO-OPS:9751364:C1 | -64.7050 | 17.7500 | None |
| Lime Tree Bay, VI | 9751401 | urn:ioos:sensor:NOAA.NOS.CO-OPS:9751401:C1 | -64.7538 | 17.6947 | None |
| Charlotte Amalie, VI | 9751639 | urn:ioos:sensor:NOAA.NOS.CO-OPS:9751639:C1 | -64.9200 | 18.3358 | None |
| Isabel Segunda, Vieques Island, PR | 9752619 | urn:ioos:sensor:NOAA.NOS.CO-OPS:9752619:C1 | -65.4438 | 18.1525 | None |
| Esperanza, Vieques Island, PR | 9752695 | urn:ioos:sensor:NOAA.NOS.CO-OPS:9752695:C1 | -65.4714 | 18.0939 | None |
| Fajardo, PR | 9753216 | urn:ioos:sensor:NOAA.NOS.CO-OPS:9753216:C1 | -65.6311 | 18.3352 | None |
| Yabucoa Harbor, PR | 9754228 | urn:ioos:sensor:NOAA.NOS.CO-OPS:9754228:C1 | -65.8330 | 18.0551 | None |
| San Juan, La Puntilla, San Juan Bay, PR | 9755371 | urn:ioos:sensor:NOAA.NOS.CO-OPS:9755371:C1 | -66.1164 | 18.4592 | None |
| Arecibo, PR | 9757809 | urn:ioos:sensor:NOAA.NOS.CO-OPS:9757809:C1 | -66.7024 | 18.4805 | None |
| Magueyes Island, PR | 9759110 | urn:ioos:sensor:NOAA.NOS.CO-OPS:9759110:C1 | -67.0464 | 17.9701 | None |
| Mayaguez, PR | 9759394 | urn:ioos:sensor:NOAA.NOS.CO-OPS:9759394:C1 | -67.1625 | 18.2189 | None |
| Barbuda, Antigua and Barbuda | 9761115 | urn:ioos:sensor:NOAA.NOS.CO-OPS:9761115:C1 | -61.8206 | 17.5908 | None |
85 rows × 5 columns
For simplicity we will use only the stations that have both wind speed and sea surface height and reject those that have only one or the other.
common = set(ssh_table["station_code"]).intersection(wind_speed_table["station_code"])
ssh_obs, win_obs = [], []
for station in common:
ssh_obs.extend([obs for obs in ssh if obs._metadata["station_code"] == station])
win_obs.extend(
[obs for obs in wind_speed if obs._metadata["station_code"] == station]
)
index = pd.date_range(start=start, end=end, freq="15min")
# Re-index and rename series.
ssh_observations = []
for series in ssh_obs:
_metadata = series._metadata
series.index = series.index.tz_localize(None)
obs = series.reindex(index=index, limit=1, method="nearest")
obs._metadata = _metadata
obs.name = _metadata["station_name"]
ssh_observations.append(obs)
winds_observations = []
for series in win_obs:
_metadata = series._metadata
series.index = series.index.tz_localize(None)
obs = series.reindex(index=index, limit=1, method="nearest")
obs._metadata = _metadata
obs.name = _metadata["station_name"]
winds_observations.append(obs)
Let’s take a look at some stations to see if the data is OK. Below we have a station in Naples, FL along the Gulf of Mexico.
%matplotlib inline
import matplotlib.pyplot as plt
try:
station = "8725110"
w = [obs for obs in winds_observations if obs._metadata["station_code"] == station][
0
]
s = [obs for obs in ssh_observations if obs._metadata["station_code"] == station][0]
fig, ax = plt.subplots(figsize=(17, 3.75))
s["2017-9-10":].plot(ax=ax, label="Sea surface height (m)", color="#0000ff")
ax1 = w["2017-9-10":].plot(
ax=ax, label="Wind speed (m/s)", color="#9900cc", secondary_y=True
)
ax.set_title(w._metadata["station_name"])
lines = ax.get_lines() + ax.right_ax.get_lines()
ax.legend(lines, [l.get_label() for l in lines], loc="upper left")
ax.axhline(0, color="black")
ax.set_ylabel("Sea surface height (m)", color="#0000ff")
ax.right_ax.set_ylabel("Wind speed (m/s)", color="#9900cc")
ax1.annotate(
"Eye of the hurricane",
xy=(w["2017-9-10":].argmin().to_pydatetime(), w["2017-9-10":].min()),
xytext=(5, 10),
textcoords="offset points",
arrowprops=dict(arrowstyle="simple", facecolor="crimson"),
)
ax.grid(True)
except Exception:
print("Cannot find station {}".format(station))
/home/filipe/miniconda3/envs/IOOS/lib/python3.7/site-packages/ipykernel_launcher.py:23: FutureWarning:
The current behaviour of 'Series.argmin' is deprecated, use 'idxmin'
instead.
The behavior of 'argmin' will be corrected to return the positional
minimum in the future. For now, use 'series.values.argmin' or
'np.argmin(np.array(values))' to get the position of the minimum
row.
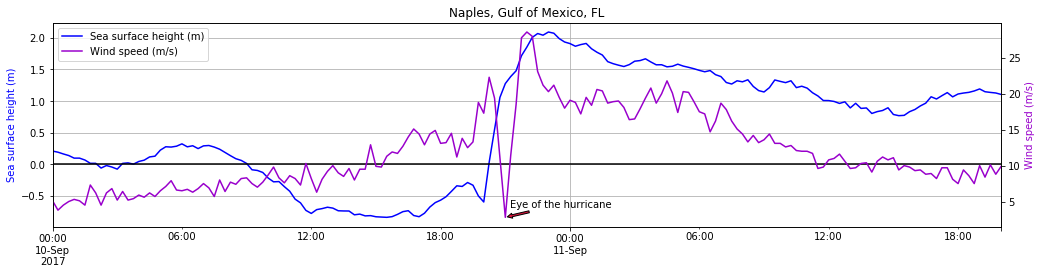
We can observe the sea level retreating around 10-Sep 9:00 and then a significant surge after 19:00. The lower winds at beginning of the surge is probably the eye of the hurricane.
For our interactive map we will use bokeh HTML plots instead of the usual raster matplotlib ones to enhance the user experience when exploring the graphs.
from bokeh.embed import file_html
from bokeh.models import HoverTool, LinearAxis, Range1d
from bokeh.plotting import figure
from bokeh.resources import CDN
from folium import IFrame
# Plot defaults.
tools = "pan,box_zoom,reset"
width, height = 750, 250
def make_plot(ssh, wind):
p = figure(
toolbar_location="above",
x_axis_type="datetime",
width=width,
height=height,
tools=tools,
title=ssh.name,
)
p.yaxis.axis_label = "wind speed (m/s)"
l0 = p.line(
x=wind.index,
y=wind.values,
line_width=5,
line_cap="round",
line_join="round",
legend="wind speed (m/s)",
color="#9900cc",
alpha=0.5,
)
p.extra_y_ranges = {}
p.extra_y_ranges["y2"] = Range1d(start=-1, end=3.5)
p.add_layout(LinearAxis(y_range_name="y2", axis_label="ssh (m)"), "right")
l1 = p.line(
x=ssh.index,
y=ssh.values,
line_width=5,
line_cap="round",
line_join="round",
legend="ssh (m)",
color="#0000ff",
alpha=0.5,
y_range_name="y2",
)
p.legend.location = "top_left"
p.add_tools(
HoverTool(tooltips=[("wind speed (m/s)", "@y"),], renderers=[l0],),
HoverTool(tooltips=[("ssh (m)", "@y"),], renderers=[l1],),
)
return p
def make_marker(p, location, fname):
html = file_html(p, CDN, fname)
iframe = IFrame(html, width=width + 45, height=height + 80)
popup = folium.Popup(iframe, max_width=2650)
icon = folium.Icon(color="green", icon="stats")
marker = folium.Marker(location=location, popup=popup, icon=icon)
return marker
Here is the final result. Explore the map by clicking on the map features plotted!
import folium
from folium.plugins import Fullscreen, MarkerCluster
from ioos_tools.ioos import get_coordinates
lon = track.centroid.x
lat = track.centroid.y
m = folium.Map(location=[lat, lon], tiles="OpenStreetMap", zoom_start=4)
Fullscreen(position="topright", force_separate_button=True).add_to(m)
marker_cluster0 = MarkerCluster(name="Observations")
marker_cluster1 = MarkerCluster(name="Past predictions")
marker_cluster0.add_to(m)
marker_cluster1.add_to(m)
url = "http://oos.soest.hawaii.edu/thredds/wms/hioos/satellite/dhw_5km"
w0 = folium.WmsTileLayer(
url,
name="Sea Surface Temperature",
fmt="image/png",
layers="CRW_SST",
attr="PacIOOS TDS",
overlay=True,
transparent=True,
)
w0.add_to(m)
url = "http://hfrnet.ucsd.edu/thredds/wms/HFRNet/USEGC/6km/hourly/RTV"
w1 = folium.WmsTileLayer(
url,
name="HF Radar",
fmt="image/png",
layers="surface_sea_water_velocity",
attr="HFRNet",
overlay=True,
transparent=True,
)
w1.add_to(m)
def style_function(feature):
return {
"fillOpacity": 0,
"color": "black",
"stroke": 1,
"weight": 0.5,
"opacity": 0.2,
}
# Latest cone prediction.
latest = cones[-1]
folium.GeoJson(
data=latest.__geo_interface__,
name="Cone prediction as of {}".format(latest["ADVDATE"].values[0]),
).add_to(m)
# Past cone predictions.
for cone in cones[:-1]:
folium.GeoJson(data=cone.__geo_interface__, style_function=style_function,).add_to(
marker_cluster1
)
# Latest points prediction.
for k, row in pts.iterrows():
date = row["FLDATELBL"]
hclass = row["TCDVLP"]
location = row["LAT"], row["LON"]
popup = "{}<br>{}".format(date, hclass)
folium.CircleMarker(
location=location, radius=10, fill=True, color=colors[hclass], popup=popup,
).add_to(m)
# All the points along the track.
for point in points:
date = point["FLDATELBL"]
hclass = point["TCDVLP"]
location = point["LAT"], point["LON"]
popup = "{}<br>{}".format(date, hclass)
folium.CircleMarker(
location=location, radius=5, fill=True, color=colors[hclass], popup=popup,
).add_to(m)
# Observations.
for ssh, wind in zip(ssh_observations, winds_observations):
fname = ssh._metadata["station_code"]
location = ssh._metadata["lat"], ssh._metadata["lon"]
p = make_plot(ssh, wind)
marker = make_marker(p, location=location, fname=fname)
marker.add_to(marker_cluster0)
folium.LayerControl().add_to(m)
p = folium.PolyLine(get_coordinates(bbox), color="#009933", weight=1, opacity=0.2)
p.add_to(m)
def embed_map(m):
from IPython.display import HTML
m.save("index.html")
with open("index.html") as f:
html = f.read()
iframe = '<iframe srcdoc="{srcdoc}" style="width: 100%; height: 750px; border: none"></iframe>'
srcdoc = html.replace('"', """)
return HTML(iframe.format(srcdoc=srcdoc))
embed_map(m)
/home/filipe/miniconda3/envs/IOOS/lib/python3.7/site-packages/IPython/core/display.py:689: UserWarning: Consider using IPython.display.IFrame instead
warnings.warn("Consider using IPython.display.IFrame instead")